
If this is your first time visiting www.teledyneleemanlabs.com and/or stumbling upon our blog, Teledyne Leeman Labs has been in the business of making benchtop mercury analyzers for over 30 years. Myself, I’ve been with the company, wearing a variety of different hats, for 24 years. Prior to landing this 24-year gig, I was an analytical research chemist at the University of North Dakota’s Energy and Environmental Research Center (EERC) in Grand Forks, ND. So, with a career like this, I’ve seen a lot of data - some good, and some not so good!
When a laboratory analyst receives samples for analysis, it initiates a process that includes numerous considerations. The assay needed for the sample could include one, two, and/or multiple parameters to report each sample’s respective concentration. Depending on the parameters, the starting process could be ultra-trace and/or run-of-the-mill preparations. At the completion of the entire process, what value will your data have, and will it be scrutinized by someone else? What quality assurance processes should you employ? Can you anticipate any potential reason to take a deeper dive into the sample data? How will your environmental laboratory report be reviewed?
A typical sample analysis scenario is outlined below:
Inside the lab:
- Samples are received
- Samples are processed and analyzed
- Data is validated and reported
Outside of the lab:
- Data is reviewed/revalidated
- Data is summarized (tabularized)
- A Lab report is saved in an Appendix/Attachment
As an environmental laboratory analyst, there is a high probability that your data will be examined by an outside reviewer. In order to support your data, what tools can you use to identify and assess biased data? Considerations include:
- Should you include spot checks on preparation methods?
- What about the analysis spectra, peak timing, and peak shapes?
- Are the sample spikes meeting the target value or are they “barely” within the quality criterion?
- How and who decides if the data is free from bias?
- Are there any historically identified limitations for the method and techniques being used?
- Do the samples require dilutions to bring them within control limits?
Let’s discuss your laboratory control sample (LCS), matrix spike, method control blanks, and duplicates in greater detail:
- The LCS should be a clean material (matrix-dependent) spiked with the parameters of interest in the laboratory. The LCS sample follows the same process as the unknowns being digested. The LCS will also help measure the laboratory and system performance, as well as any impact the sample matrix will have on analysis.
- Matrix spikes only indicate that you were able to get the spike out of the matrix. They do not verify that your method completely liberated the analyte of interest at 100%. However, spikes will tell you if a matrix interference exists and/or if there is loss during the digestion process.
- Control blanks are highly important, as they will let you know if there is any bias in the analytical process. The control blank must be subjected to every step of the analytical process, no matter how small or insignificant, one perceives that step to be. All steps are created equal in the eyes of the analytical procedure.
- Duplicates will tell you about the homogeneity of the sample and indicate that the analytical process is “somewhat” valid (and equal for every sample). But we still don’t know if the results yielded are a true value of what’s contained in the sample! Typically, we consider the analysis successful if the relative percent difference (RPD) is <20 %. Having achieved the specified < value, we can assume that it is a good indicator that a systemic problem does not exist within the analytical process.
So, when we review all our checks and balances, we report what we believe is the value in the sample – IF AND ONLY IF - they all check out.
REALITY CHECK! Let me tell you about a real-world example I was studying recently:
Lately I was working of a new project: Mercury Concentration in Beverages. One of my first beverage solutions tested was coffee - I drink a lot of coffee, so this study was relevant to my health! I used a microwave ICP-MS digestion method referenced in USFDA Elemental Analysis Manual (EAM 4.7) as a starting reference point, but with the intent to use CVAA as the analysis technique.
I digested seven coffee samples along with a control blank and pre-digest spike. I also performed a post-digest spike for inclusion in the analytical batch. Even though CVAA is a very different technique from the scope of the original method, I was hopeful the analysis would be successful. I reviewed the printed results for the coffee data and on the surface everything looked great, but that was only a superficial view. Here were the results:
- ICV is 97.4 %
- CCV is 103%
- Digest Spikes at ~ 0.05 µg/L
- Pre-digest Spike 90%
- Post-digest Spike 94.7%
- Coffee digests were very reproducible and consistent at ~ 0.02 µg/L before blank correction to ~ 0
- Digest has 8% Nitric / 1% HCl / 1% H2O2 and the calibration standards are 4% Nitric / 0.5% HCl. The premise behind the calibration matrix is some percentage acids and peroxide are consumed thus use a lower matrix value contribution for the calibration standards.
So, with the quality control information above I should be able to submit my results and deem the analytical process a success, correct? Or, should I take a deeper look at the results, before I tell someone not to drink coffee?
Below are the spectra for the control blank and an extracted coffee sample. The QC data indicated that the sample didn’t have any issues, BUT if that was true then the spectra of the control blank and the sample should match – they should mirror each other - BUT they don’t!
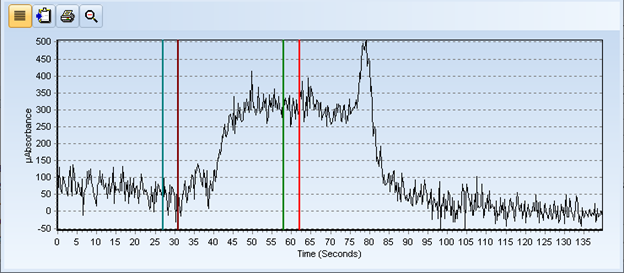
Figure 1: Spectra of Control Blank
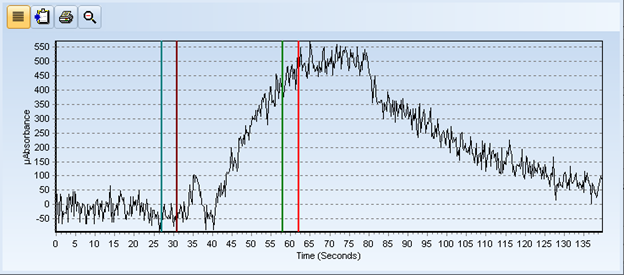
Figure 2: Spectra of Digested Coffee Sample
After further review of the spectra, it appears that either a kinetics issue or a valence state problem was affecting the digest’s ability to oxidize the mercury to Hg2+ in the sample. I’ll be working out the kinks in my process and I let you know how it all turns out in Part 2 of this blog (to be posted shortly).
In conclusion, environmental laboratory reports contain a lot of valuable information for better or worse, and the case study presented here should give one pause to not take the results at face value. As an analyst we should always strive to look beyond the horizon for the truest answer we can possibly report!
Click for more information on our application notes
Contact us if you would like additional information on this topic or any of our products